Welcome Guest! To enable all features please Đăng nhập or Đăng ký.
Hình như thế này thì hoàn toàn mình không biết làm thế nào luôn í, các bạn giải thích giúp mình với. Lần đầu tiên mình gặp hình như thế này.
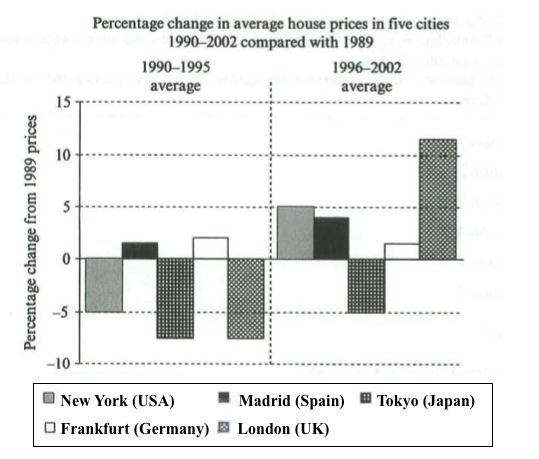
The chart below shows information about changes in average house prices in five different cities between 1990 and 2002 compared with the average house prices in 1989.
Sửa bởi quản trị viên
2013-10-23T06:27:01Z
|
Lý do: Chưa rõ
Dù dạng đề như thế nào thì bạn cũng nghĩ ngay đến form chung của task 1 rồi từ từ làm theo yêu cầu của từng phần.
1. Introduction: viết lại yêu cầu đề
2. Overview: viết 2 câu:
- câu 1: 1 câu miêu tả xu hướng chung
- câu 2: nói về 1 cái gì nổi trội nhất.
3. Detail: tùy bạn chọn và hệ thống bài của bạn
4. Detail:
Đối với đề bài trên bạn có thể làm như sau:
1. Introduction:
2. Overview: bạn có thể viết 2 câu sau:
- câu 1: so sánh 2 quá trình(giá giảm từ 1990-95, nhưng tăng lại 1996-2002)
- câu 2: giá của London tăng nhiều nhất.
3. Detail: nói về 1 quá trình từ 1990-95
4. Detail: nói về 1 quá trình từ 1996-2002
Lâu rồi mới gặp dạng này, bạn chú ý "-5%", bạn đừng viết "-5%", mà nên viết là "fell by 5%".
Thầy mình nói có 2 cách viết 2 đoạn detail.
Cách 1: số cao nhất, các số liệu còn lại
Cách 2: các số liệu tăng, các số liệu giảm
Nhờ thầy cô sửa giúp em bài này với, em làm thử:
The bar chart illustrates the figures for house prices in five major cities over a period of 12 years, in regard to that in 1989.
It is clear from the chart that the house price fell over all from 1990-1995, but rose from 1990-2000 especially in the USA and London.
Between 1990-1995, the house prices of the USA, Tokyo and the UK were dropped more than 5% of that of 1989, but japan and Tokyo had slight increament in the proportion of prices.
During the period 1996-2000 , tremondous alterations were recored in the house princes in the major cities except Germany and Tokyo. The house prices in the USA and the UK rose double when compared to 1990-1995 to reach 5% and 12% respectively of that in 1989. The house price in Spain rose slightly.
Mình muốn làm thử, các bạn xem giúp mình nha.
The chart illustrates and compares the average housing values in five selected metropolis over a period of 12 years compared to average house prices in 1989. In general the prices dropped over the first five years ending in 2002 but increased largely thereafter in all cities with Frankfurt being the exception.
From 1990 to 1995, housing prices generally slumped in comparison to 1989. Three of the cities (Tokyo, New York and London) saw a minimum minus 5 percent decrease in the mean value of properties. The other two cities (Madrid and Frankfurt) experienced a contrary movement with 2% and 3%.
In the second period, there was a considerable increase in the average house prices apart from in Frankfurt which saw a marginal decrease of 1%. The other cities increased in value ranged between 2 and 20%, London seeing the largest rise. Despite, the increase Tokyo still remained below the average house prices in 1989.
Bài các bạn viết hoàn chỉnh rồi đấy, tuy cách viết 2 đoạn detail khác nhau nhưng cái đó viết tùy theo ý của từng người mà.
Mình tìm được bài mẫu cho các bạn rồi nè.
The bar chart compares the cost of an average house in five major cities over a period of 13 years from 1989.
We can see that house prices fell overall between 1990 and 1995, but most of the cities saw rising prices between 1996 and 2002. London experienced by far the greatest changes in house prices over the 13-year period.
Over the 5 years after 1989, the cost of average homes in Tokyo and London dropped by around 7%, while New York house prices went down by 5%. By contrast, prices rose by approximately 2% in both Madrid and Frankfurt.
Between 1996 and 2002, London house prices jumped to around 12% above the 1989 average. Homebuyers in New York also had to pay significantly more, with prices rising to 5% above the 1989 average, but homes in Tokyo remained cheaper than they were in 1989. The cost of an average home in Madrid rose by a further 2%, while prices in Frankfurt remained stable.
(165 words)
Sửa bởi người viết
2013-10-23T08:01:04Z
|
Lý do: Chưa rõ
Bài mình làm thử, các bạn cùng xem giúp mình nha.
The bar graph tells the information about the percentage of house prices in five countries, over a 13-year period from 1989.
Between 1990 and 1995, two nations tied at house pricing and fell by approximately 7% and these are Tokyo and London,Whereas New York city dropped by only 5%.By contrast, the city of Spain and Frankfurt, the average cost of houses are 2% and 3% respectively.
In 1996 to 2002, house prices in three major cities showed increased in sales. The price rose dramatically for Japan, at 12 per cent. Also, both US and Madrid marked improvement in selling houses during 1996 to 2002. The former had 5 per cent while the latter was just 1 per cent less. However, Germany did not boost its profit which fell by 1%,and also Tokyo remained weak in house prices with 5%.
Overall, The London cost of houses was by far the highest among the five nations, between 1996 to 2002, While over a period of five years after 1990 for Japan and London house prices remained weak.
Di chuyển
- Bạn không thể tạo chủ đề mới trong diễn đàn này.
- Bạn không thể trả lời chủ đề trong diễn đàn này.
- Bạn không thể xóa bài của bạn trong diễn đàn này.
- Bạn không thể sửa bài của bạn trong diễn đàn này.
- Bạn không thể tạo bình chọn trong diễn đàn này.
- Bạn không thể bỏ phiếu bình chọn trong diễn đàn này.
Important Information:
The Trang chủ Diễn đàn chuyên IELTS uses cookies. By continuing to browse this site, you are agreeing to our use of cookies.
More Details
Close