Welcome Guest! To enable all features please Đăng nhập or Đăng ký.
Cái đề thế này:
You should spend about 20 minutes on this task.
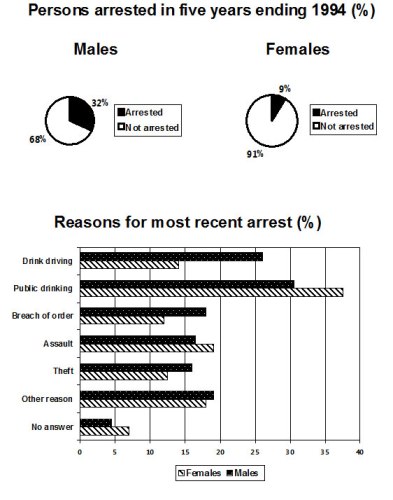
The pie chart shows the percentage of persons arrested in the five years ending 1994 and the bar chart shows the most recent reasons for arrest.
Summarize the information by selecting and reporting the main features and make comparisons where relevant.
Write at least 150 words.
Phải làm thế nào vậy. Các bạn giúp mình với. Thanks.
Sửa bởi người viết
2013-07-12T17:26:19Z
|
Lý do: Chưa rõ
Model Answer
The pie chart illustrates the percentage of males and females who were arrested from 1989 to 1994, while the bar chart compares the main reasons that the different genders were arrested most recently. It is evident from the charts that males were arrested more than females and that public drinking was the most common reason for arrest for both.
To begin, the proportion of males arrested was much greater than for females. 32% were arrested compared to only 9% for women. Turning to the reasons for the most recent arrests, there were some clear differences between men and women. Men were twice as likely to be arrested for drink driving than women, at 26% and 14% respectively. Breach of order, assault, and other reasons were also slightly higher for men, all standing at around 12-18%. Interestingly though, women experienced a higher percentage of arrest rates for assault and public drinking. The figures for assault were fairly similar at approximately 18%, whereas public drinking represented the main reason for arrest, with women at a massive 38%, compared to 31% for men.
(180 Words)
Di chuyển
- Bạn không thể tạo chủ đề mới trong diễn đàn này.
- Bạn không thể trả lời chủ đề trong diễn đàn này.
- Bạn không thể xóa bài của bạn trong diễn đàn này.
- Bạn không thể sửa bài của bạn trong diễn đàn này.
- Bạn không thể tạo bình chọn trong diễn đàn này.
- Bạn không thể bỏ phiếu bình chọn trong diễn đàn này.
Important Information:
The Trang chủ Diễn đàn chuyên IELTS uses cookies. By continuing to browse this site, you are agreeing to our use of cookies.
More Details
Close