Welcome Guest! To enable all features please Đăng nhập or Đăng ký.
Có bài mẫu này hay, post lên cho các bạn cùng xem này.

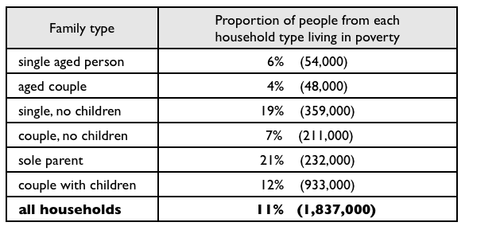
Topic: he table below shows the proportion of different categories of families living in poverty in Australia in 1999.
1) The chart compares percentages of Australians from six different family types who were classed as poor in 1999.
2) The table gives information about poverty rates among six types of household in Australia in the year 1999.
3) The table compares different categories of Australian families in terms of the proportion of people living below the poverty line in each one.
Sửa bởi quản trị viên
2013-10-03T08:25:42Z
|
Lý do: Chưa rõ
Di chuyển
- Bạn không thể tạo chủ đề mới trong diễn đàn này.
- Bạn không thể trả lời chủ đề trong diễn đàn này.
- Bạn không thể xóa bài của bạn trong diễn đàn này.
- Bạn không thể sửa bài của bạn trong diễn đàn này.
- Bạn không thể tạo bình chọn trong diễn đàn này.
- Bạn không thể bỏ phiếu bình chọn trong diễn đàn này.
Important Information:
The Trang chủ Diễn đàn chuyên IELTS uses cookies. By continuing to browse this site, you are agreeing to our use of cookies.
More Details
Close
