Không sao đâu bạn, mình rất vui vì có người nhiệt tình học với mình mà.
Đối với writing task 1 cần 2 điều:
- a summary of information shown in a graph,chart, table or diagram
- a clear overview of main trends, differences or stages.
Bạn nhìn lại Bảng miêu tả band điểm 7 ở trên đi, người ta không có nhắc đến conclusion. Bản thân overview chính là conclusion rồi. Bạn cứ vô tư đặt nó ở 1 trong 2 vị trí mình đã nêu là được.
MÌnhpost cho bạn xem một bài mẫu khác, ví dụ về 2 vị trí đó nữa nè.
BÀI 1: overview SAU “ introduction”
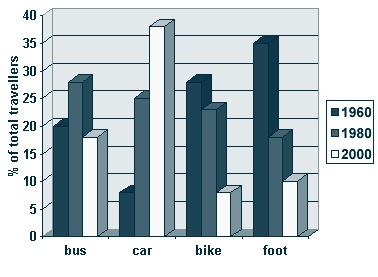
The graphbelow shows the different modes of transport used to travel to and from work inone European city in 1960, 1980 and 2000.
Summarise the information by selecting and reporting the mainfeatures, and make comparisons where relevant.

The chart provides informationabout the percentage of commuters in a European city who used to commute bybus, car, bike or foot in 1960, 1980 and 2000.
Overall, it is obvious that thepercentage who used the different modes of transport changed over the 40 years,with a significantly higher percentage using a car to commute in 2000 and amuch lower percentage traveling to/from work by bike or foot than hadpreviously been seen.
The percentage of commuters whoused to drive to/from work increased from being the least common type oftransport at around 7% in 1960 to being the most common means at over 35% in2000. In contrast, the percentage who cycled and walked to/from work decreasedfrom around 27% to 7% and 35% to 10% from 1960 to 2000 respectively.
The percentage who travelled bybus was at its highest in 1980 with over 25%. The figure in both the otheryears was below 20%.
Word count: 161
BÀI 2: overview SAU “ summary”
The chart provides information about the percentage of commutersin a European city who used to commute by bus, car, bike or foot in 1960, 1980and 2000.
The percentage of commuters whoused to drive to/from work increased from being the least common type oftransport at around 7% in 1960 to being the most common means at over 35% in2000. In contrast, the percentage who cycled and walked to/from work decreasedfrom around 27% to 7% and 35% to 10% from 1960 to 2000 respectively.
The percentage who travelled bybus was at its highest in 1980 with over 25%. The figure in both the otheryears was below 20%.
In conclusion, it is obvious thatthe percentage who used the different modes of transport changed over the 40years, with a significantly higher percentage using a car to commute in 2000and a much lower percentage traveling to/from work by bike or foot than hadpreviously been seen.
Word count: 162
Sửa bởi quản trị viên
2013-06-19T17:00:38Z
|
Lý do: Chưa rõ
A wise man will make more opportunities than he finds.
