loveyou
  • Bài viết: 48
  • Gia nhập: 08-05-2013

Em thấy có một đề thế này: 

The chart shows the number of men and women in further education in Britain in three periods and whether they were studying fulltime or part-time.

Summarise the information by selecting and reporting the main features, and make comparisons where relevant.

Nhiều sách hay liệt kê một số dạng đề hay ch trong task  1này, nhưng không hề có dạng summarise. Đây là dạng đề ngoại lệ hay sao? ngoài dạng này còn dạng nào có thể cho như vậy nữa không? Cám ơn mọi người.

phuongthao
  • Bài viết: 181
  • Gia nhập: 16-05-2013

Chào bạn, 

Dạng này cũng như WRITE A REPORT...DESCRIBING... thôi. Khi làm dạng này em nhớ phải có 3 ý quan trọng sau: 

  1. Một câu nhận định chung cho vấn đề bắt đầu bằng Overall.
  2. Miêu tả những đặc điểm nổi bật.
  3. Có những lý giải hoặc ví dụ minh họa cho những đặc điểm nổi bật trên.


A wise man will make more opportunities than he finds.
sunset
  • Bài viết: 37
  • Gia nhập: 08-05-2013
Bạn cho hỏi, ví dụ trng đề bài trên thì mình viết câu nhận định chung như thế nào?

phuongthao
  • Bài viết: 181
  • Gia nhập: 16-05-2013

 Ý overview mình in đậm đấy, mình đưa nó trong cả bài để bạn dễ xem và so sánh với bài của bạn làm nha.

The chart shows how many men and women were taking fulltime and part-time courses in further education in Britain in three selected years between 1970 and 1991. Overall, we can see that the numbers of both genders in part-time education were considerably higher than those in full-time education in each of the three years.

The number of men taking full-time courses increased from just under 100 000 in 1970/71 to around 200 000 in 1990/91, but still remained a fraction of the number studying part-time (about 900 000 in 1990/91). Likewise, although the number of women in full-time education went up by a similar amount to that of men, it was dwarfed by the number studying part-time.

Comparing the figures of men and women, the only significant differences were for part-time education in 1970/71 and 1990/91. In the first of these years, there were 1 million men in part-time education compared to around 700 000 women, but in 1990/91 the number of men and women studying part-time were approximately 900 000 and 1.1 million respectively.

Word count: 174


A wise man will make more opportunities than he finds.
sunset
  • Bài viết: 37
  • Gia nhập: 08-05-2013
Bạn nói thêm tí về Overview đi. Mình chưa hiểu lắm.
phuongthao
  • Bài viết: 181
  • Gia nhập: 16-05-2013

Cần có một câu nhận định chung cho mọi bài Writing Academic IETLS task 1. Các biểu đồ thể hiện quá trình do đó cần có một câu tổng kết về quá trình biến đổi qua các giai đoạn. Còn đối với các biểu đồ tròn hãy có một câu nhận định về các sự khác nhau chính yếu giữa các ý được so sánh.

Trong thang điểm chấm của giám khảo, họ chi thế này: "IELTS band score 7: “[Candidate] presents a clear overview of main trends, differences or stages". Trước đây mình không biết, chỉ ghi qua loa phần này hà.


A wise man will make more opportunities than he finds.
sunset
  • Bài viết: 37
  • Gia nhập: 08-05-2013
Nếu là nhận xét chung vậy thì mình có thể đặt nó ở CONCLUSION không?
phuongthao
  • Bài viết: 181
  • Gia nhập: 16-05-2013

Câu hỏi bạn hay nhỉ. Câu OVERVIEW này bạn nên đặt  ở đầu phần SUMMARY sau khi đã giới thiệu chủ đề, hoặc cũng có thể đặt ở cuối phần SUMMARY  để làm kết luận luôn.


A wise man will make more opportunities than he finds.
sunset
  • Bài viết: 37
  • Gia nhập: 08-05-2013

Như thế là, nếu viết overview phần SUMMARY thì không cần CONCLUSION nữa, còn nếu mình viết ở trước phần SUMMARY thì phải có CONCLUSION  nữa à?

Xin lỗi bạn, ngại quá, mình hỏi nhiều quá!

phuongthao
  • Bài viết: 181
  • Gia nhập: 16-05-2013

Không sao đâu bạn, mình rất vui vì có người nhiệt tình học với mình mà.

Đối với writing task 1 cần 2 điều:

  1.     a summary of information shown in a graph,chart, table or diagram
  2.     a clear overview of main trends, differences or stages.

Bạn nhìn lại Bảng miêu tả band điểm 7 ở trên đi, người ta không có nhắc đến conclusion. Bản thân overview chính là conclusion rồi. Bạn cứ vô tư đặt nó ở 1 trong 2 vị trí mình đã nêu là được.

MÌnhpost cho bạn xem một bài mẫu khác, ví dụ về 2 vị trí đó nữa nè.

BÀI 1: overview SAU “ introduction”

The graphbelow shows the different modes of transport used to travel to and from work inone European city in 1960, 1980 and 2000.

Summarise the information by selecting and reporting the mainfeatures, and make comparisons where relevant.

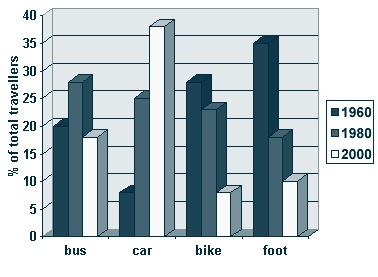
The chart provides informationabout the percentage of commuters in a European city who used to commute bybus, car, bike or foot in 1960, 1980 and 2000.

Overall, it is obvious that thepercentage who used the different modes of transport changed over the 40 years,with a significantly higher percentage using a car to commute in 2000 and amuch lower percentage traveling to/from work by bike or foot than hadpreviously been seen.

The percentage of commuters whoused to drive to/from work increased from being the least common type oftransport at around 7% in 1960 to being the most common means at over 35% in2000. In contrast, the percentage who cycled and walked to/from work decreasedfrom around 27% to 7% and 35% to 10% from 1960 to 2000 respectively.

The percentage who travelled bybus was at its highest in 1980 with over 25%. The figure in both the otheryears was below 20%.

Word count: 161

BÀI 2: overview SAU “ summary”

The chart provides information about the percentage of commutersin a European city who used to commute by bus, car, bike or foot in 1960, 1980and 2000.

The percentage of commuters whoused to drive to/from work increased from being the least common type oftransport at around 7% in 1960 to being the most common means at over 35% in2000. In contrast, the percentage who cycled and walked to/from work decreasedfrom around 27% to 7% and 35% to 10% from 1960 to 2000 respectively.

The percentage who travelled bybus was at its highest in 1980 with over 25%. The figure in both the otheryears was below 20%.

In conclusion, it is obvious thatthe percentage who used the different modes of transport changed over the 40years, with a significantly higher percentage using a car to commute in 2000and a much lower percentage traveling to/from work by bike or foot than hadpreviously been seen.

Word count: 162


A wise man will make more opportunities than he finds.
sunset
  • Bài viết: 37
  • Gia nhập: 08-05-2013
Cám ơn phuongthao, bài của bạn hay quá.
phuongthao
  • Bài viết: 181
  • Gia nhập: 16-05-2013

Mình rất vui vì bạn thấy nó hữu ích.


A wise man will make more opportunities than he finds.
Ai đang xem chủ đề này?
  •  Guest
Di chuyển  
  • Bạn không thể tạo chủ đề mới trong diễn đàn này.
  • Bạn không thể trả lời chủ đề trong diễn đàn này.
  • Bạn không thể xóa bài của bạn trong diễn đàn này.
  • Bạn không thể sửa bài của bạn trong diễn đàn này.
  • Bạn không thể tạo bình chọn trong diễn đàn này.
  • Bạn không thể bỏ phiếu bình chọn trong diễn đàn này.